
Key takeaways
- A performance dashboard consolidates all building data to provide clear insights, enabling faster action and increased asset value.
- Key performance metrics to to track can be split up into three categories: energy and emissions, indoor climate and operational performance.
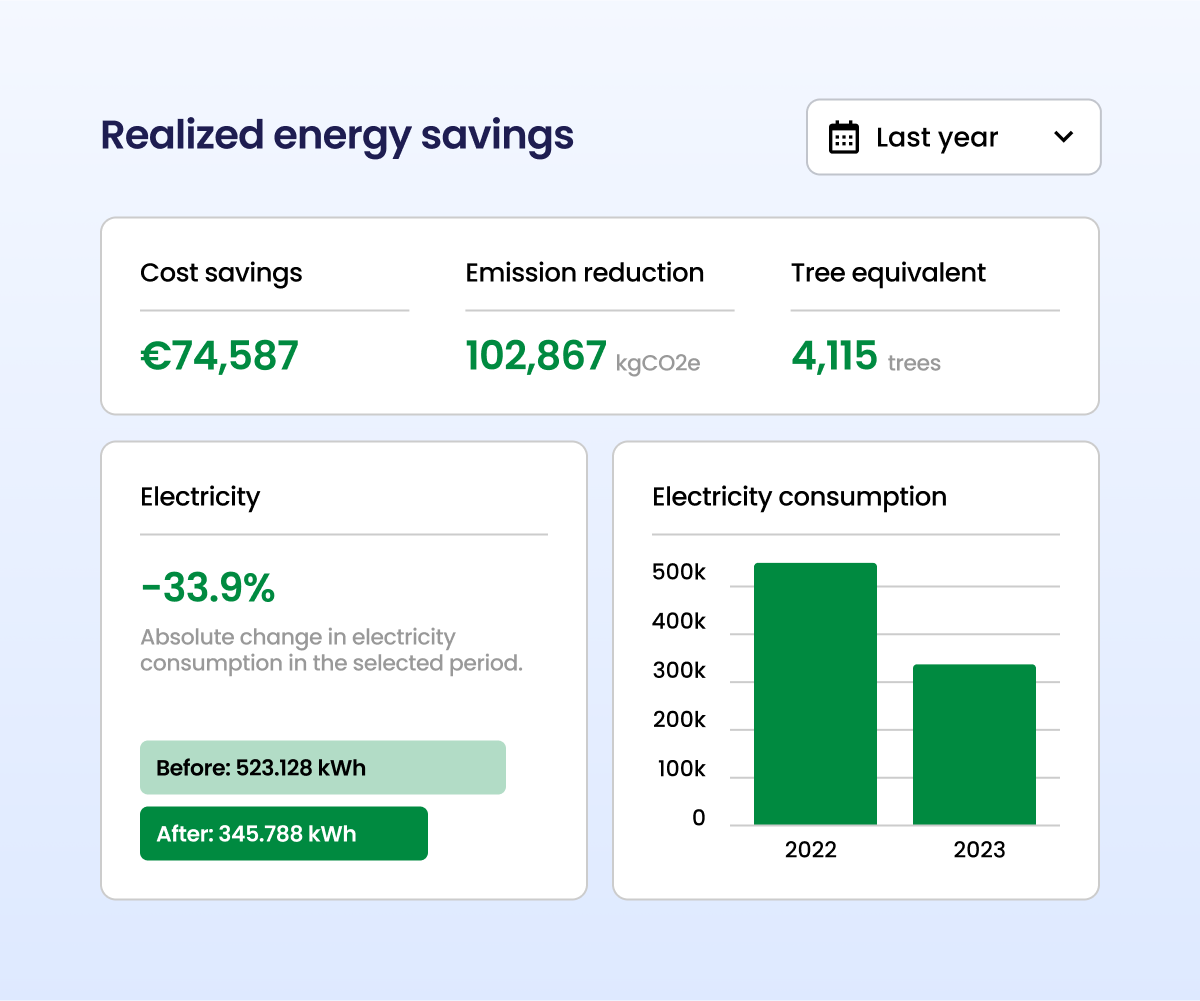
- Energy and emission data monitors the total consumption, CO₂ output, and data from submeters, benchmarking performance against standards like CRREM and BREEAM to assess stranding risks.
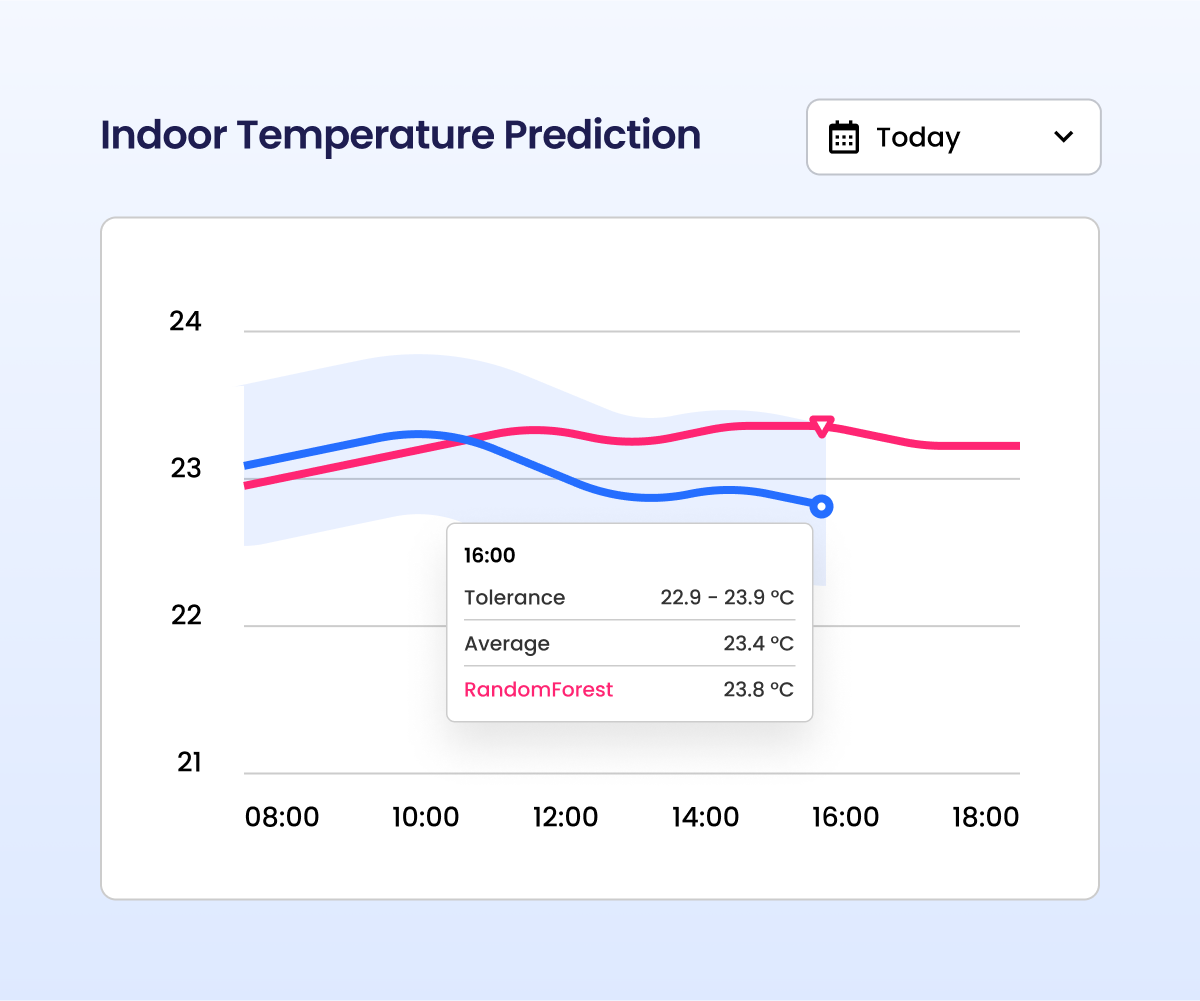
- Indoor climate tracks real-time temperature, CO₂, and humidity levels, and links tenant complaints directly to sensor data for quick issue resolution.
- Operational performance gives a full view of system health through direct BMS integration. You immediately see incorrect settings, inefficient schedules and deviations.
- The Healthy Workers dashboard brings every layer of building data together, from energy use and comfort scores to system health and compliance.
- This data-driven approach is critical for meeting upcoming requirements such as the 2026 GACS regulations for continuous monitoring and optimization in large non-residential buildings.
Key building performance metrics to track
Every building generates data, but not all of it tells you what you need to know. Most portfolios still rely on scattered systems and manual reports, making it difficult to spot inefficiencies or compare assets objectively. So the key question is, what’s part of a modern dashboard and what should you actually track to turn building data into action? Let’s break it down.
Energy use and emissions
Energy data is the basis of building performance. With a clear view of consumption and emissions across your portfolio, you can spot inefficiencies early and make decisions based on facts, not assumptions. Here’s what insight you’ll need.
- Total energy consumption: Track electricity, gas, district heating and renewables in one clear view to spot inefficiencies and compare assets easily.
- Emissions per building and portfolio: Monitor CO₂ output across all assets to identify high-impact buildings and stay aligned with climate targets.
- Data from PV panels, water meters, and submeters: Automatically collect and harmonize all generation and consumption data for a complete, accurate picture of performance.
- Decarbonization and energy benchmarks: Benchmark portfolio energy performance against CRREM pathways, energy labels and BREEAM criteria to assess stranding risks, validate reductions and stay aligned with climate targets.
Indoor climate and air quality
Comfort is just as important as efficiency. Real-time insights into CO₂, humidity and temperature help you spot issues early and maintain a healthy, stable indoor environment.
- Temperature, CO₂ and humidity: Monitor key comfort parameters in real time to spot deviations early and maintain stable, healthy indoor conditions.
- Comfort, health and indoor environment benchmarks: Benchmark indoor climate performance against WELL, PvE, Bouwbesluit and Gezonde Kantoren to assess compliance, identify gaps and translate comfort data into targeted improvement actions.
- Complaints and service request handling: Link tenant feedback directly to sensor data to diagnose and resolve issues quickly, reducing frustration and building trust.
Operational and system performance
Building systems have a major impact on efficiency. Real-time performance insights make technical issues visible early, helping you avoid waste, reduce costs and keep conditions stable.
- Real-time system health: Monitor HVAC, lighting and ventilation through direct BMS integration to spot irregularities before they cause downtime or discomfort.
- Automated fault detection and system diagnostics: Detect irregularities early and understand what’s causing them, so teams can act before issues escalate.
- Data-driven optimization: Use continuous system insights to identify improvement opportunities, reduce energy waste and extend equipment life through proactive fine-tuning.
Now you know what data insights you need to optimize your buildings, let’s have a look at how you can implement a performance dashboard to improve your portfolio.
How a building performance dashboard improves your portfolio
Bringing all these metrics together in a single dashboard offers enormous value. It turns day-to-day monitoring into strategic asset management and transforms fragmented data into one clear, actionable overview. Healthy Workers helps you accelerate portfolio performance across energy, comfort, compliance, and investment strategy.
Here’s how that leads to increased asset performance:
- Save energy and reduce operational costs: Centralized insights make it easy to identify inefficiencies portfolio-wide, automate optimizations, and cut energy use by up to 15–50% without costly upgrades.
- Increase tenant satisfaction and retention: Link comfort data to tenant feedback for faster response times, fewer complaints, and higher satisfaction.
- Speed up ESG compliance and certifications: Connect building data directly to frameworks like WELL, BREEAM, and CRREM to simplify reporting and track progress across assets.
- Make smarter investment decisions: Use performance data to target the assets with the highest ROI potential and align every upgrade with ESG goals.
- Make CapEx investments smarter: By reducing waste and improving system settings, you extend equipment life and time upgrades more strategically.
According to the ENERGY STAR Commercial Real Estate Guide, portfolios that consistently track performance metrics and use them to guide operations achieve higher net operating income (NOI) and stronger tenant retention.
That same data-driven approach becomes even more important with the 2026 GACS-requirements. Because as from January first 2026, large non-residential buildings must have a Building Automation and Control System (GACS) that continuously monitors, analyses and optimizes energy use and building installations in line with EPBD and NEN-EN-ISO 52120.
With Healthy Workers, you comply with the new GACS regulations and save energy and costs at the same time, without making expensive GBS upgrades. Find out more about GACS here.
A real estate dashboard example: how Healthy Workers brings it all together
Healthy Workers brings every layer of building data together, from energy use and comfort scores to system health and compliance. No more spreadsheets or fragmented tools, just one clear view of how every asset performs.
You instantly see where energy is wasted, which buildings fall behind benchmarks like CRREM or WELL, and how recent optimizations affect results. Fault detection and live performance insights highlight what needs attention, so issues are fixed before they become costly. By using this type of performance dashboard you get a single source of truth for your entire portfolio
turn raw numbers into concrete actions, supported by our full-service approach where experts coordinate recurring improvements with installers and property managers.
A real-life example comes from VORM Holding, which is now able to manage its buildings in a fully data-driven way thanks to its collaboration with Healthy Workers.
The team has real-time insight into crucial parameters such as energy consumption, CO₂ levels, indoor climate conditions, and peak loads. As a result, they can optimize far beyond what is possible with construction-based upgrades alone.
"We want more control over the work of installation companies. With data and remote access, we've reduced disruptions, cut energy use, lowered costs, and improved tenant comfort."
For instance, VORM’s headquarters consumed roughly 12% less energy in 2023 compared to 2022, and 14% less in 2024. Across all buildings, the average savings are around 15%, with peaks of up to 23% at certain locations.
Frequently asked questions about real estate dashboards
Still have questions? We’ve gathered the most frequently asked questions and provide all the answers you need to improve building performance.
What are the three main categories of performance metrics to track in real estate?
A dashboard gives insights into metrics across three critical categories: energy use and emissions, indoor climate and air quality and operational and system performance. By having access to all of these insights in one dashboard, you’ll be able to transition from fragmented data to strategic asset management, enabling faster decisions that increase efficiency, tenant satisfaction, and long-term asset value.
What is the role of a real estate dashboard regarding the 2026 GACS requirements?
A dashboard is critical for GACS compliance. Starting January first, 2026, large non-residential buildings must have a Building Automation and Control System (GACS) that continuously monitors, analyzes, and optimizes energy use.
A performance dashboard provides the continuous monitoring, analysis and optimization needed for GACS compliance, without replacing your existing BMS or investing in expensive upgrades.
How does the dashboard help with ESG and decarbonization goals?
A real estate performance dashboard is a crucial tool for meeting ESG and decarbonization targets by transforming complex data into a clear, actionable strategy. It achieves this through three main functions, including enhanced benchmarking, streamlined compliance, and continuous monitoring.
Data as the basis for smart, future-proof buildings
One of the biggest challenges in improving building performance is fragmented data. Systems rarely speak the same language, leaving you with incomplete insights and slow decision-making. We (yes, Healthy Workers) solve this by connecting seamlessly with any building setup.
From traditional GBS and smart meters to modern IoT sensors. Implementation is quick and non-intrusive, with no need for expensive hardware upgrades. But we don’t stop at software. With our full-service approach, our experts help you integrate the right data sources and tell you exactly what has to be done to continuously optimize building performance.
Within our full-service approach we also offer coordination directly with any stakeholders like property managers and installers to implement recurring improvements. Instead of reactive maintenance or costly one-off interventions, you benefit from continuous, data-driven optimization delivered as a service.
Want to turn building data into high-performance buildings with a positive ROI? Get in touch today and we’ll show you how we help you to create smarter, more sustainable and profitable buildings.